Debugging a C/C++ Application
To debug any C/C++ application on the device, first install gdbserver (after an Internet connection has been set up).
To install gdbserver:
- Using a terminal emulator, open a terminal to the device (SSH, debug console or similar).
- At the command line, enter opkg update
• After files are downloaded and extracted successfully, the system displays this message: Updated list of available packages in /var/lib/opkg/mlinux-mtcdt - Then enter opkg install gdbserver
• After files are installed successfully, the system displays these messages:
Configuring libthread-db1.
Configuring gdbserver.
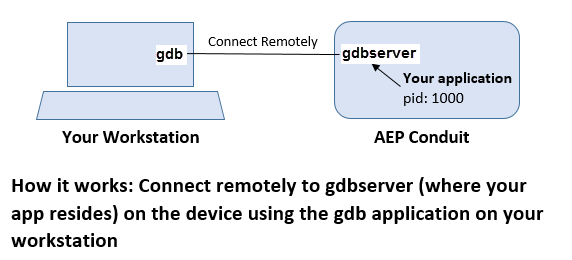
Once gdbserver is installed, you must copy your application to the Conduit® and then run it under gdbserver using the gdbserver-attach command. To use gdbserver to run your program on the device:
- Log on to the target system and run the gdbserver program. Enter this command: target> gdbserver comm program [args …]
a. comm: how to communicate with GDB
b. program: the name of your program
c. args: its arguments - Attach your application to the gdbserver using arm-mlinux-linux-gnueabi-gdb on your development workstation (included with the mLinux™ toolchain). To do this, enter the command: (gdb) target remote <target_ip>:<port>
- Refer to this information for more details on how to use gdb and gdbserver:
https://sourceware.org/gdb/onlinedocs/gdb/gdbserver-man.html